booteek Intelligence · Q2 2026 baseline edition
The booteek Index: AI visibility of the UK’s independent restaurants and bars, 2026
Published 21 July 2026 · Refreshed quarterly · All figures carry their sample size and a re-run method (see Methodology)
The headline findings
In booteek’s July-2026 panel of 283 operational UK independent restaurants and bars, profiles average 86.4 out of 100 on the seven AI-readable basics — but only 39.6% carry a specific business categorybeyond a generic “Restaurant” or “Bar”. Separately, 17 of the 300 venues sampled from our January audit had closed by July. And owners answer customers very differently by city: Leeds replies to 44.5% of reviews; Manchester, the biggest conversation we measured, replies to just 25.8%.
How complete are UK venue profiles, city by city?
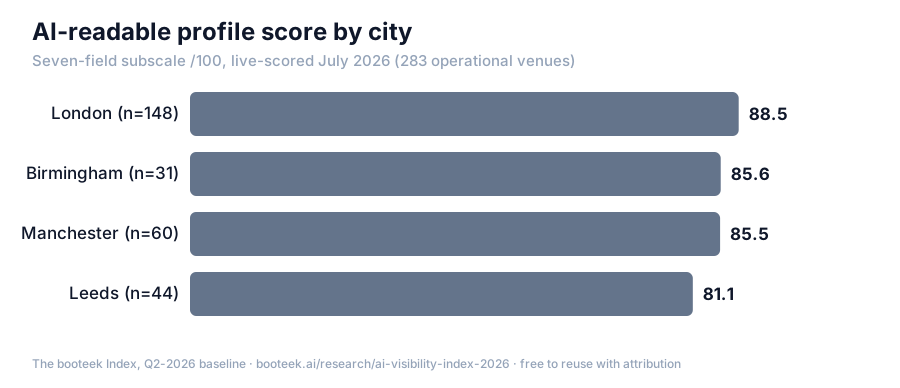
We re-scored a stratified panel of 300 venues (drawn from booteek’s January-2026 audit of 4,224 venues across 8 cities) live against Google Places in July 2026, on the seven profile fields an AI assistant can read directly. 283 were still operational. The score below is the completeness of those seven fields, weighted as booteek’s product weights them, reported out of 100.
| City | Operational venues | Avg profile score /100 |
|---|---|---|
| London | 148 | 88.5 |
| Birmingham | 31 | 85.6 |
| Manchester | 60 | 85.5 |
| Leeds | 44 | 81.1 |
Panel mean 86.4/100 (n=283 operational). 17 of the 300 sampled venues (5.7%) were no longer operational by July 2026 — 12 closed permanently, 5 temporarily. That churn rate is itself a finding about the conditions independent restaurant and bar owners are trading in.
The specificity gap: basics are done, categories are not
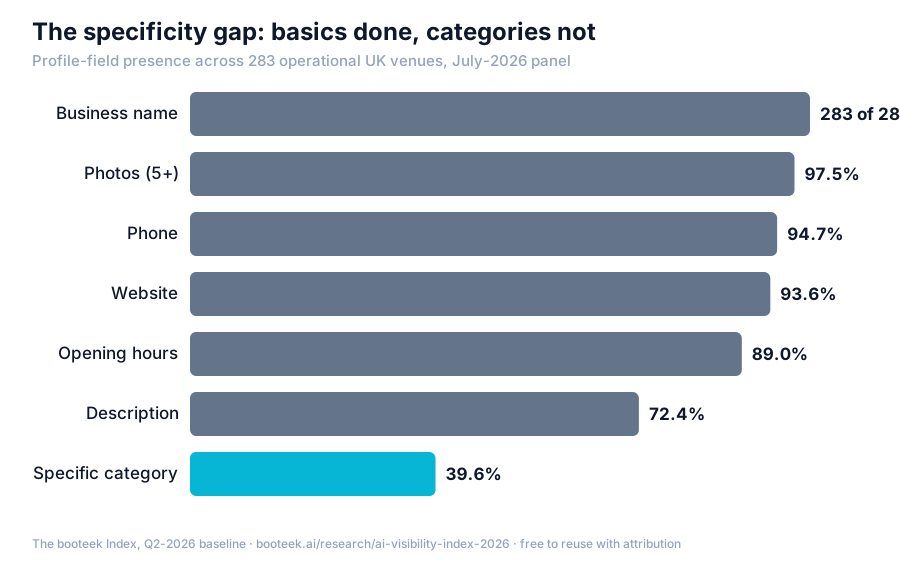
The common assumption is that independent venues neglect their online basics. Our panel says otherwise — the basics are nearly universal. What’s missing is specificity: the single field that tells an AI assistant what kind of venue you actually are.
| Profile field | Present (of 283) | Share |
|---|---|---|
| Business name | 283 | 283 of 283 |
| Photos (5 or more) | 276 | 97.5% |
| Phone number | 268 | 94.7% |
| Website link | 265 | 93.6% |
| Opening hours | 252 | 89.0% |
| Business description | 205 | 72.4% |
| Specific category (beyond generic “Restaurant”/“Bar”) | 112 | 39.6% |
A generic category is a question you can’t be the answer to: when a diner asks an assistant for “a tapas bar” or “a Neapolitan pizzeria”, a venue listed only as “Restaurant” gives the machine nothing to match.
The Response League: which cities answer their customers?
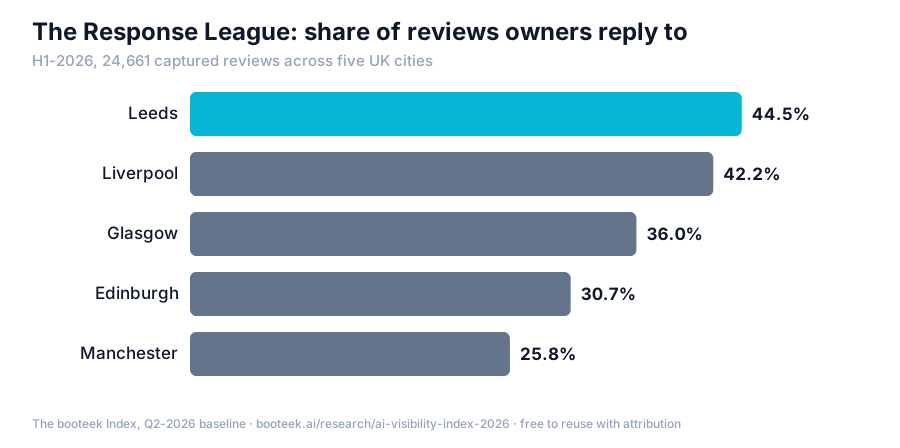
Across booteek’s H1-2026 review sample (January–June, five cities, 24,661 captured reviews), the share of reviews that received any owner reply:
| City | Owner-reply rate | H1-2026 sample |
|---|---|---|
| 1. Leeds | 44.5% | 2,512 |
| 2. Liverpool | 42.2% | 1,406 |
| 3. Glasgow | 36.0% | 1,707 |
| 4. Edinburgh | 30.7% | 3,183 |
| 5. Manchester | 25.8% | 15,853 |
Edinburgh and Glasgow rate as a statistical dead heat (4.61 vs 4.62) — but Glasgow answers more and, per diner-reported spend, charges less (~£31.7 vs ~£34.3 a head). Owner replies are among the public signals AI assistants can read when weighing venues; the quiet cities are leaving that signal to the talkative ones.
What a night out costs, in the diners’ own numbers
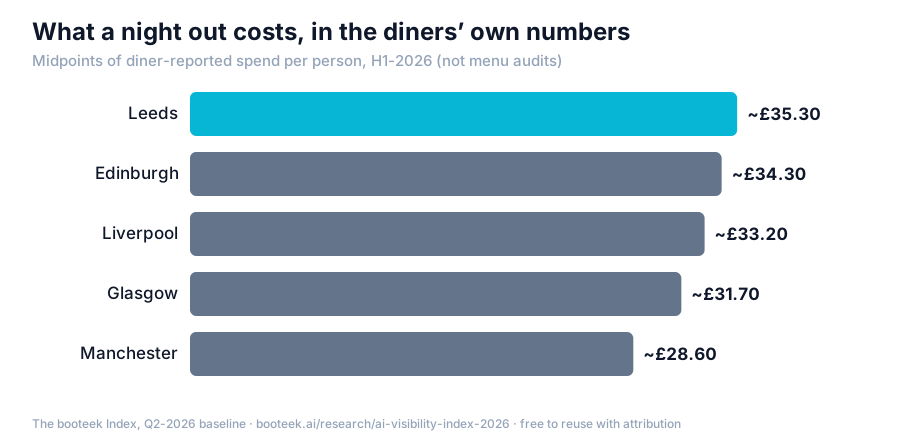
Diners increasingly report what they spent per person in their reviews. Midpoints of those reported ranges, H1 2026 — not menu audits, the crowd’s own accounting:
| City | Diner-reported spend per person |
|---|---|
| Leeds | ~£35.3 |
| Edinburgh | ~£34.3 |
| Liverpool | ~£33.2 |
| Glasgow | ~£31.7 |
| Manchester | ~£28.6 |
Leeds out-pricing Edinburgh is the line nobody expects — and Manchester pairs the cheapest big night out with the lowest reply rate in the league.
The neighbourhood twist
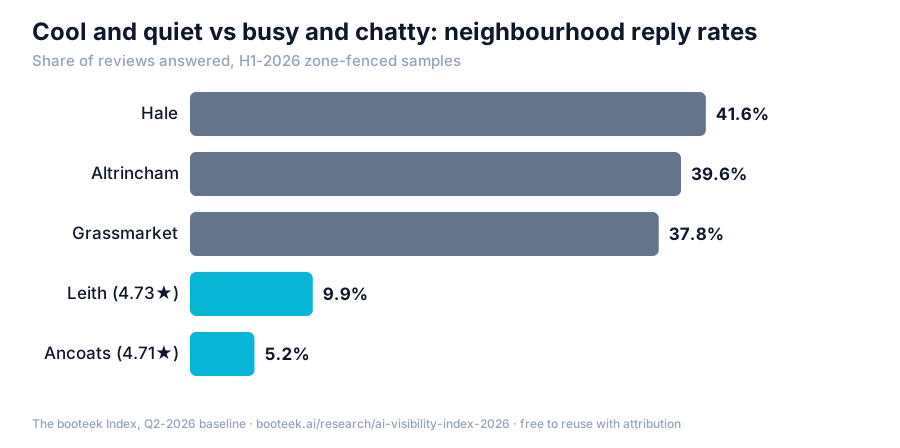
Zoom into neighbourhoods and the city averages split apart (H1-2026 zone-fenced samples):
- Ancoats, Manchester’s most feted food neighbourhood, rates 4.71 — and answers just 5.2% of its reviews (n=1,743). Suburban Altrincham (39.6%) and Hale (41.6%) reply like they mean it.
- The £18 gap: Deansgate ~£39.0 a head vs the Northern Quarter ~£20.7 — one tram stop apart.
- Edinburgh’s mirror: Leith rates highest (4.73) and answers least (9.9%); the Grassmarket answers 37.8%. Cool and quiet vs busy and chatty.
Why this matters for AI recommendations
booteek’s own probe research found the recommendation surface splits in two. Google’s AI reads your Business Profile directly — in our measurements, Google’s Maps-grounded AI was served the category for every venue it recommended, and attributes for almost all (72 probes in six Portuguese cities, 545 of 545 served profiles, 9 July 2026). Web-searching assistants such as ChatGPT and Perplexity work differently: they answer from the web pages they find — guides, review sites, blogs — where reviews, replies and coverage live.
In 72 Maps-grounded probes in six Portuguese cities on 9 July 2026, each AI answer carried only 4–14 venue slots, and the venue sets for different questions barely overlap. Specific categories, active review conversations and owner replies are how independent venues stay matchable on both surfaces.
The charts
Every chart is generated from the registered figures above and free to reuse with attribution. Right-click to save, or take the whole set in the media pack.
Methodology
The panel.A stratified sample of 300 venues (London 158, Manchester 62, Leeds 47, Birmingham 33) drawn deterministically from booteek’s January-2026 audit of 4,224 UK/PT/ES venues, stratified into thirds by prior score, and re-scored live against the Google Places API in July 2026. Scoring covers the seven profile fields observable through Places — name, description, specific category, website, phone, opening hours, photos — weighted as booteek’s product weights them (65-point basis, reported /100). Fields notmeasured by this subscale: posts, Q&A, products and services, menu links, attributes, and review-reply behaviour inside the profile. 283 of 300 venues were operational at re-score.
The review corpus.Owner-reply rates, ratings and prices come from booteek’s proprietary corpus of captured public reviews, windowed to H1 2026 (1 January – 30 June, review publication date). Reply rate = share of captured reviews with any owner response. Prices are midpoints of diner-reported per-person spend ranges — not menu audits. Neighbourhood samples are fenced to canonical zone boundaries. Sample sizes are printed with every figure; captured samples are not the population of all reviews.
Cadence. The Index is quarterly, each edition named for the completed quarter it reports. Comparisons publish only quarter-over-quarter, like-for-like — same panel, same channel, same scorer. Q2 2026 is the baseline edition (published July 2026); no trend claims are made from it.
Provenance.Every figure on this page is registered in booteek’s internal data-assertions ledger with a re-run command that recomputes it from named database columns on demand. Journalists and researchers can request the methodology detail or the underlying aggregates: [email protected].
Limitations (read before citing)
- The panel is a stratified sample of a January-2026 audit universe, not a census of all UK venues.
- Rating differences of 0.01 are reported as dead heats, never winners.
- Review-based figures describe booteek’s captured sample; sample sizes are stated wherever a figure appears.
- Price figures are diner-reported, midpoint-averaged, and skew toward diners who choose to report spend.
- This is a baseline edition: quarter-over-quarter trends begin with the Q3-2026 edition, published October 2026.
Frequently asked questions
What is the booteek Index?
The booteek Index is a quarterly benchmark of how visible and readable independent restaurants and bars are to AI assistants, built from booteek’s proprietary data: a stratified UK venue panel re-scored live each quarter, plus a review corpus covering owner-response behaviour, ratings and diner-reported prices. Q2 2026 is the baseline edition (published July 2026).
Which profile fields do UK venues most often leave empty?
In the July-2026 panel of 283 operational venues, the basics are nearly universal — name (283 of 283), photos (97.5%), phone (94.7%), website (93.6%), opening hours (89.0%). The two real gaps are the business description (present for 72.4%) and, above all, a specific business category: only 39.6% carry one beyond a generic "Restaurant" or "Bar".
Which UK city’s restaurant and bar owners reply to reviews most?
In booteek’s H1-2026 review sample, Leeds owners replied to 44.5% of captured reviews — the highest of the five cities measured — followed by Liverpool (42.2%), Glasgow (36.0%) and Edinburgh (30.7%). Manchester, the largest review conversation in the sample, replied least at 25.8%.
How often is the Index updated?
Quarterly. Comparisons are published only quarter-over-quarter on a like-for-like basis — same panel design, same collection channel, same scoring. Q2 2026 is the baseline edition; the first trend edition, covering Q3, publishes in October 2026.
booteek helps independent restaurant and bar owners close exactly these gaps — starting with a Competitor Check of how your profile reads next to the venues you compete with.
Cite as: booteek Intelligence, “The booteek Index: AI Visibility of UK Restaurants & Bars”, Q2-2026 baseline edition, published 21 July 2026, booteek.ai/research/ai-visibility-index-2026. Attribution with a link is welcome.